Over the past decade, conditions in China have become ever more important for the global economy and the markets that trade it. At the same time, the opacity of the political and market systems behind “Capitalism with Chinese Characteristics” has put western investors in the unenviable position of being ever more dependent on the outcomes from a system most do not understand. The chart below shows our current picture of conditions in China.
Indicator of China Conditions
Last year we saw the consequences of that ‘tail wagging the dog’ phenomena. Dollar strength and policy tightening (in the US and China) led to deteriorating conditions in China which eventually flowed through to broad EM weakness and a sell-off in US markets. Midway through the year, Chinese policymakers shifted back to easing, which, when combined with a Q4 ‘pivot’ by the Fed, supported financial assets and economic activity.
Reacting to this policy easing, conditions in China have begun to improve, with prices for financial assets and commodities relatively strong and early indications of a bottom in real economic activity.
At the same time, the secular picture for the Chinese credit system remains ugly, with lots of noise about regulation, restructuring and reform, but no actual ‘deleveraging.’ With this in mind, we recommend investors take a bullish position in inflation-sensitive “soft” agricultural commodities (sugar, cocoa and coffee), hedged with a bearish position in the Hong Kong Dollar. This pairing represents a joint positive carry and positive convexity way to play both the inflationary upside of improving demand in China, as well as a world in which liquidity issues in the Chinese financial system result in a deflationary deleveraging and potential break in the peg to the USD.
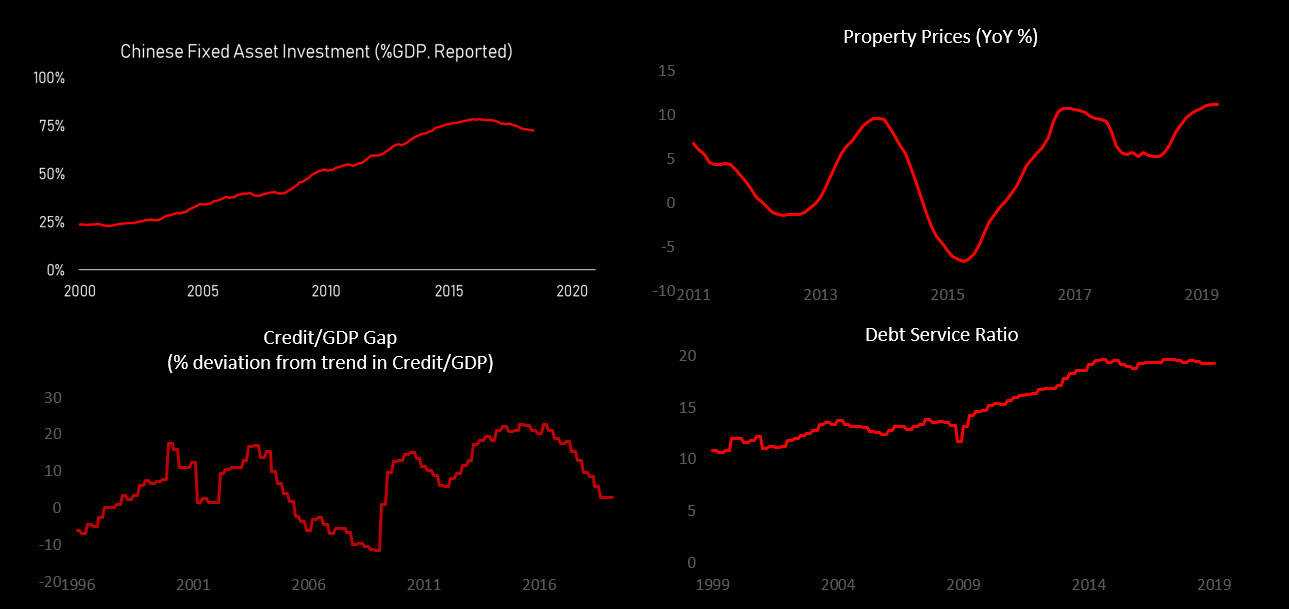
There is a Credit Bubble In China
Two years ago at the Drobny Global Macro conference, we presented a framework for thinking about China in the context of the global cycle. This framework, detailed below, remains relevant amidst the noise of tit-for-tat tweets on sneakers and soybeans that populate our information channels these days.
1. There is a credit bubble in China.
2. The losses from this bubble will be large (and growing).
3. (Wise) Policymakers are aware of the problem, but have thus far been unwilling, or unable, to stop it.
Two years later, policymakers have made some progress curbing the worst excesses of an out of control shadow banking system without tackling the fundamental issues at play. Specifically, too much money which is leading to too much investment, therefore resulting in a domestic economy saddled with too much debt.
China Crisis Indicator
And in spite of years of talk of deleveraging, China and Hong Kong continue to top estimates of forward financial crisis risk.
During this time, banks have shifted to new lending from companies to households, who have in turn levered up to buy into ever more expensive real estate. While Chinese real estate data is notoriously sketchy, our best estimate is that real estate in second tier cities is now on par with that of developed nations like the US. Though with much lower household income levels to support those valuations.
Meanwhile, on the margin, the rest of the world has become ever more dependent on Chinese money creation, investment, and growth.
The way this story plays out will impact investors of every asset class. It is a well-established fact that Chinese conditions are a dominant driver of many energy and metal commodities markets. However, what we believe many investors are missing, is the degree to which the entire global economy is essentially long the Chinese credit bubble.
With the goal of understanding what’s going on in the Chinese economy today, we turn our attention to the notoriously sketchy data in China.
Answering the simplest questions with respect to growth conditions can be especially challenging in a country with scarce and unreliable data like China. Even in the best of circumstances, we would argue that GDP data is a poor measure of economic activity due to its low frequency, revisions, and lags. This is especially the case in China where Li Keqiang famously proclaimed that GDP statistics to be ‘man made’ and ‘for reference only’ while preferring rough proxies like electricity consumption, rail cargo volume and bank lending as a more accurate measure of cyclical momentum.
The Chinese Data Reliability Problem:
To solve this problem, we propose a theory fundamentally based on macro linkages.
In practice, the lines between these forces is much more blurry
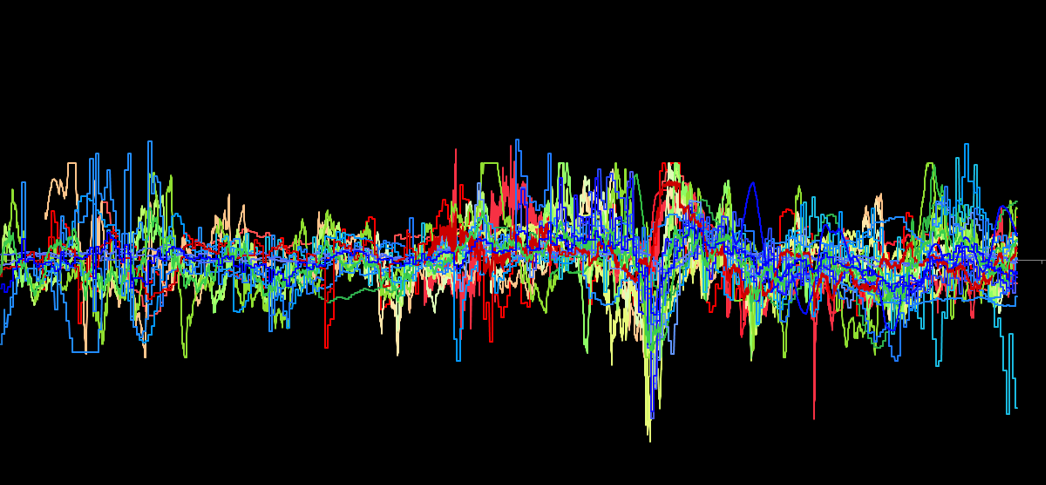
And the reality, is that even after combing through thousands of time series and cleaning them up, you are left with something that looks like this.
There's signal in this noise though, and by applying our framework for thinking about the Chinese economy we can see how policy has been used as a tool to manage first prices, and ultimately economic activity. Going into the beginning of last year, activity and prices were hot, and the government was tightening policy too manged. After six months of deterioration, policy shifted dramatically easier, which has begun to flow through to improvements in first prices, and potentially activity.
Machine – What Would a Machine Say?
Other than thinking through the causal linkages (aka deductive logic), one can also rely on unsupervised machine learning techniques like principal component analysis (aka inductive logic) to break down the underlying economic structure of the Chinese economy.
We started by gathering all the data we could find (100+ time series) for China from various categories: 1) money & credit aggregates, 2) real economy (GDP & components), 3) government sector, 4) external sector, 5) financial market prices, 6) property market, 7) consumer and corporate surveys and 8) alternative data (e.g. satellite).
We then transformed and normalized (z-score) the data in order to run a PCA.
We found that the 3 first principal components explained over 60% of the total variance. The first principal component loaded highly on measures of economic activity (figure 1), the second principal component loaded highly on measures of financial conditions (figure 2), and the third principal component loaded highly on measures like the external balance (figure 3).
Interestingly, the machine learning approach corroborates the notion that financial conditions (policy + prices) and activity are the key moving parts in the Chinese economy (figure 4).
Although information content with respect to growth/activity can lead to better asset allocation decisions, we are more interested in which if any markets our indicators can trade. The tables below compare the buy and hold risk-adjusted returns of various betas and markets to those using a simple scaling rule conditioning on our policy impulse indicator using monthly data. The rule scales exposure long or short each market based on the indicator’s value (z-score) the previous month (t-1).
This testing results tell a pretty logical story. Understanding conditions in China is helpful to understanding the future returns of some, but not all, assets. In particular it looks like this model has edge in understanding commodities, particularly those linked to Chinese demand.
With that in mind, we propose investors allocate capital into a strategy that has positive exposure to a rebound in Chinese conditions, but a positive carry, positive convexity way to play the protect that view from the existential risks of a liquidity event in China.
Below, we show the expected value matrix of our preferred trade expressions: a long position in Sugar in HKD, or 1) long sugar and 2) long USDHKD.
The genesis for this trade was made through extensive research using the Rose platform. If you are interested in viewing the data in an interactive environment, then please click the link below and play around with our platform. In addition, we would love to hear any feedback that you have regarding Rose if you do use it.
https://rose.ai/dashboard/china.system.drobny.notebook.20190424


