is this thing on?
2021 Outlook: The Beginning or the End.
When you look back at your life
you think about the glory and the pain
When you look back at your book
you think about the “Big Ones”
These days feels like the world is full of ‘one(s) that got away’
Now we’re chasing the bubble higher
because when interest rates go negative
any future worth living in
is one full of new rockets, plains, trains, cars, and money.
All running on electricity
Election Night 2020
Friends,
As of this evening, FiveThirtyEight is giving Biden a 90% chance of taking the White House. While over at PredictIt, Biden is trading at 65%. Forecast, the new prediction market app from Facebook, has "Trump will concede within one month" trading at 68.
In spite of our respect and admiration for Nate Silver (the founder of FiveThirtyEight, who's work on baseball over at Baseball Prospectus in the mid 2000s was a big influence on me getting into data science), we have to go with the markets here.
As we like to say around these parts: #DontTrustMachines.
"Trump to win" at 10:1 seems cheap, given the uncertainty inherent in mail-in voting during a pandemic and the lessons of 2016. "Trump causes chaos in November" seems even cheaper. Will be interesting to see how foreign demand for ever-more US bond issuance holds up if we get a couple of months of legal shenanigans coming out of the election.
With that in mind, we wanted to send you our thoughts on 200 years of inflation data.
Seriously.
See, we at Black Snow Capital think it's times like these where one can really see the value in going back and looking at history. Value in asking - in a year that's historically scared, sick, stressed, and on fire - "How weird can things get?"
Our view, contained in this note, is simple:
1. What we are experiencing is something the world has experienced in the past, and will experience again in the future.
2. This crisis unfolded, and was reacted to by policymakers, much faster than previous ones.
3. The forces of deflation still linger, though against a backdrop that is increasingly inflationary. For the time being, COVID, and what looks to be another lockdown, will likely act as a strong deflationary force, capping inflation. This deflation, ironically, enables monetary policies that explicitly (though unintentionally) promote asset bubbles. These bubbles, when popped, require more easing, which then pushes up asset prices further. This process continues ad infinitum unless brought to an end by the onset of inflation and monetary tightening.
4. Over long periods of time, the biggest driver of inflation in the developed world is actually conflict, not left-right politics or fiscal conservatism. This was our most surprising finding, and something we believe underappreciated by both modern investors and academics.
5. Consistent with inflationary pressures building in both the medium-term (via the shift to deficit monetization) and long-term (via the shift into a neo-Cold War), we recommend investors with large government bond exposures shift some (or more) of that exposure into gold.
Never before have you been rewarded so little for lending money so long...while the spectre of inflation rumbles slowly to life.
Mark to Market
A year ago, we said you should own gold.
Nine months ago, we said own the tails.
Two months from now, we find out if we get Trump in 2020 or Trump in 2024.
In the meantime, our views are by and large the same.
Be it gold vs oil, stocks vs bonds, or dollars vs yuan,
…ya gotta own the tails right now.
2020 Outlook: Buy.The.Tails.
Sometimes we write long soliloquys on the future of machine learning, or reflections on knowing vs not knowing.
Sometimes the long pieces say the same thing as your gut…in terms of 2020:
Gotta own both tails.
Anyone telling you otherwise is either synthesizing poorly, or selling you something.
Breakout
Don’t look now, but gold started one of it’s sneaky holiday runs over the last couple of weeks…
On the Lehman prop desk, we used to talk wistfully about lock box trades
The idea that sometimes you actually have more confidence about the price a couple of months from now than you have about the price next week. That wouldn’t it be great if you could just take a high conviction idea, commit to it, weight it appropriately, and stick it in the lock box. Only being able to open up the box at the expiry of the option.
Now, you might ask yourself, why not just ‘commit’ to a trade and then put it in a virtual lock box?
And the answer here being the obvious usual mark to market pressures that any money manager faces. Your MD or CIO doesn’t want to hear about your wonderful ideas squirreled away when the rest of the market is making money. People want money today not money tomorrow.
Anyway, up to this point we’ve treated our Gold position as a bit of a lockbox trade. Partially by design, and partially because as an emerging (read: rather small) fund, we don’t really have access to the kind of daily liquidity that a lot of other ‘fast money’ managers get. When it costs you 15% to get into a trade, and 15% to get out, you can’t be day trading your best ideas, and when you are capital constrained you can’t even really trade around the ‘delta’ of these kind of options.
So by hook or by crook, we’ve mostly just called out shot and then kept the position. This has made us look a little too good in August when Gold was roofing, and then a little too bad in Q4 when the fluff got cleansed amongst a (mostly) strong dollar.
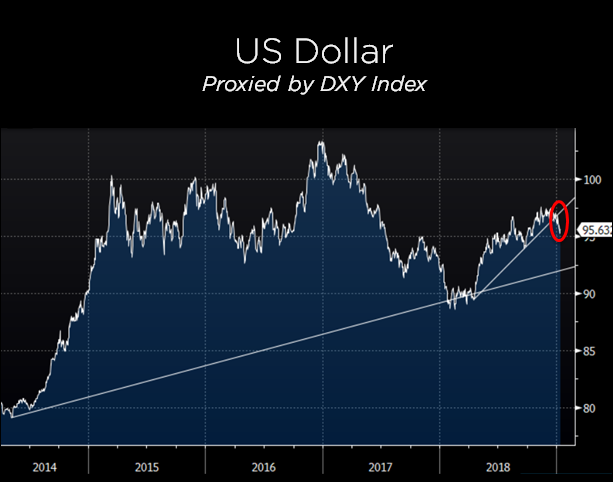
Given the dollar is looking weak (be it Bernie or deficits, or just the fact that the gap between US and Japanese/European monetary policy has narrowed), gold prices in dollars should appreciate, and looks like we are starting to see that.
Meanwhile, over in China. The bullish case for gold is:
1) The shift back to easing by the PBOC (RRR cuts announced today, and talk of supporting money and credit growth in line with GDP growth)
2) The yearly reset of the $50k cap on purchases of FX, and we could start to see some movement in Gold in China again. .
And that pesky trade deal that’s still not signed. Let’s see if it’s done Jan 15, or if, like seemingly every Brexit-EU deadline, it’s punted while the big wigs work out the “details” (read: actual differences).
Didn’t we see China say they weren’t going to change the rules for ‘any one country” the other day?
Maybe that’s the point, like all good ‘define the relationship’ conversations, it’s about if China sees/appreciates that the US’s role in the world isn’t ‘one of many’ but rather ‘the one that matters’.
What if Volcker killed the Soviet Union
…back when you had to raise rates to kill inflation.
We’re not so sure the machine works the same way these days.
Seems like these days, lower rates stimulates production a lot more than consumption.
Lower rates today, and you get more supply of scooters, and apps.
Lower rates today, and you get more supply of…oil.
Raise rates from here, and all of a sudden the investments in future capacity don’t look so rosy.
Raise rates from here, the cost of capital for a lot of shale drillers becomes too high to drill.
Raise rates here, and you contract oil supply…increasing the price. Which is inflation.
So rather than stimulate demand through lower rates, we’ve gotten to a tricky place.
A place where there is so much money, in the hands of so few, that interest rates don’t really matter for demand.
After all, Demand is about the 99%.
Lower rates don’t stimulate demand if demand is just poor people who are already levered up.
On the other hand, lower rates do matter for supply.
Maybe enough to flip the direction of that linkage, for a time.
Begging the question, if Volcker killed the Soviet Union by raising rates (forcing the uneconomic communist machine to say Uncle) then what would raising rates do today, and who’s ready for that world?
What if we lived in a world where the Chair of the Fed smoked during the press conference
Cultural Dissonance
What if the issue with the #tradeWar was a disagreement about culture and not economics?
Seems like at the moment, democracy is working on two channels, to undermine the party.
The first in the democracy #overthere, voting out Beijing in favor of Democracy.
Hongkongers voting for Democracy, November 2019
And then in the democracy #overHere, with it’s pesky Constitution, messing up Trump’s veto.
You think anyone’s clued Xi in to Article 1, Section 7 yet?
Imagine being the poor aide tasked with that doing that briefing…
Now maaaaayybe Congress decides to over-ride the veto. Maybe it doesn’t. Point being, it’s at least plausible that the bill is now out of Trump’s (tiny) hands. Plausible deniability. Now it’s in the arms of that most dangerous agent of chaos, a Legislature.
It’s like the scaled up version of the UK’s House of Commons, negotiating against the monolithic EU. Will they, won’t they? A geopolitical manifestation of Ross and Rachel on Friends. if you will. Then again that lasted ten seasons…
Anyway.
Our is not to reason why, ours is but to see that gap, and go buy gamma accordingly.
Things that don't add up
Another run on a (small) regional bank in Liaoning…
School in HK closed for the semester so mainlanders can escape HK for Shenzen.
Meanwhile, the Senate threatens to pass the HK bill. The one that the CCP has called deserving of “stern representation”
All while Xi pledges to:
“control and rule” (管制) Hong Kong (and Macau)
What's the Deal?
Reports out today that Trump and China (may) have a deal.
https://www.nytimes.com/2019/10/11/business/economy/us-china-trade-deal.html
A little hard to find details. Apparently this is “Phase One”, where the only thing agreed upon is China is going to buy some more food from the US and promise not to devalue their currency.
All in exchange for a promise not to raise tariffs (again).
Not a bad deal.
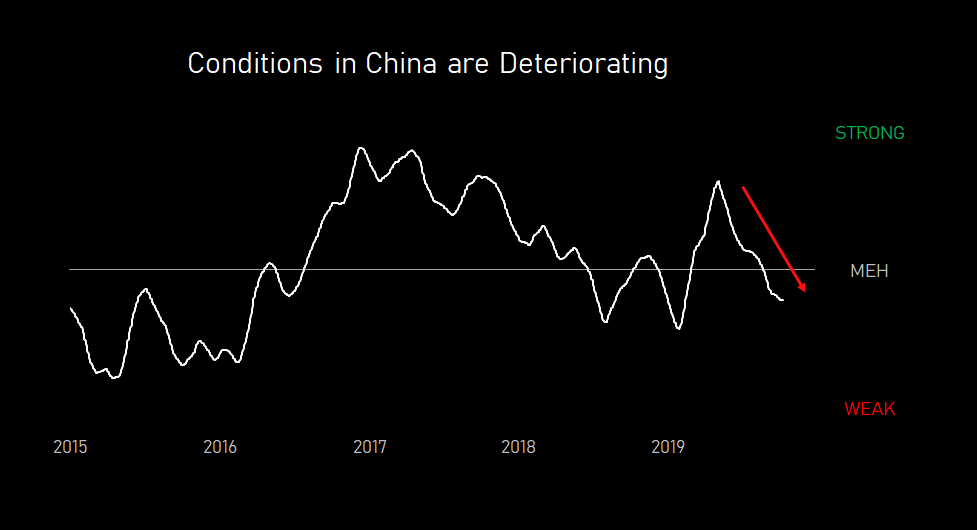
Thing is, by our measures, conditions in China are deteriorating.
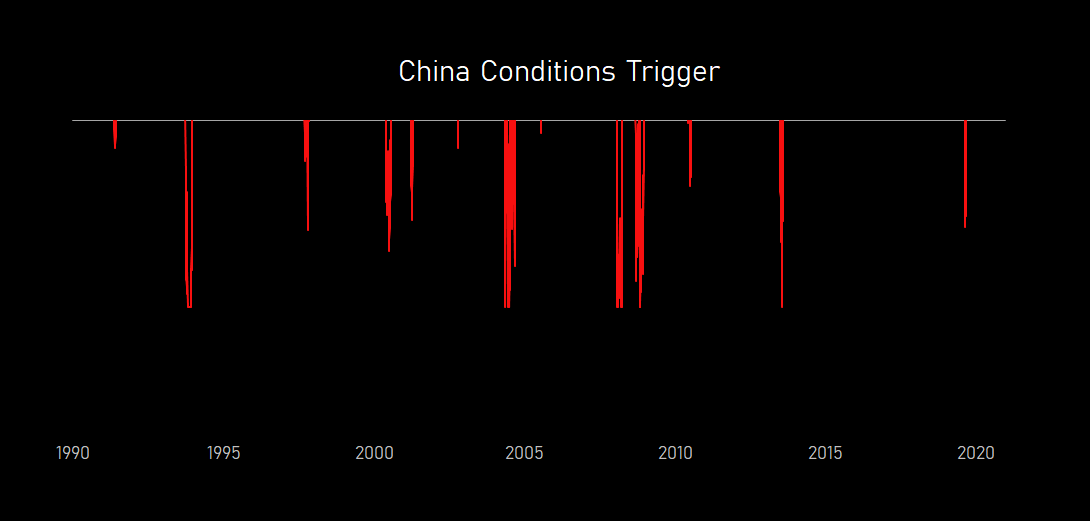
Say what you will about home-brew indicators, but looking back, we’ve only seen things deteriorate this fast over 6m a handful of times since 1990:
Which might make you wonder, how are things deteriorating, and why?
When we break that conditions indicator into pieces, we get a story. One that jibes with our understanding of what’s been happening.
If you only focused on activity, then you’d think conditions in China weakened starting in the middle of last year, and pretty much been weak ever since.
What looked like strength in the beginning of last year, was the flow through from easier policy, and higher prices for commodities and financial assets.
As that stimulation has rolled off, and turned to tightness, so has strength in the prices financial assets and commodities.
Meaning, it looks like the Chinese policy easing passed through entirely to better conditions in prices in the financial sector, with little to no impact on real economic activity.
So why hasn’t real economic activity responded to the dual shock of stronger policy and strong prices?
Maybe it has something to do with the external conditions China faces. Both in terms of it’s weaker trade balance, and persistent capital outflows (in spite of many controls).
Trade War probably didn’t help either…
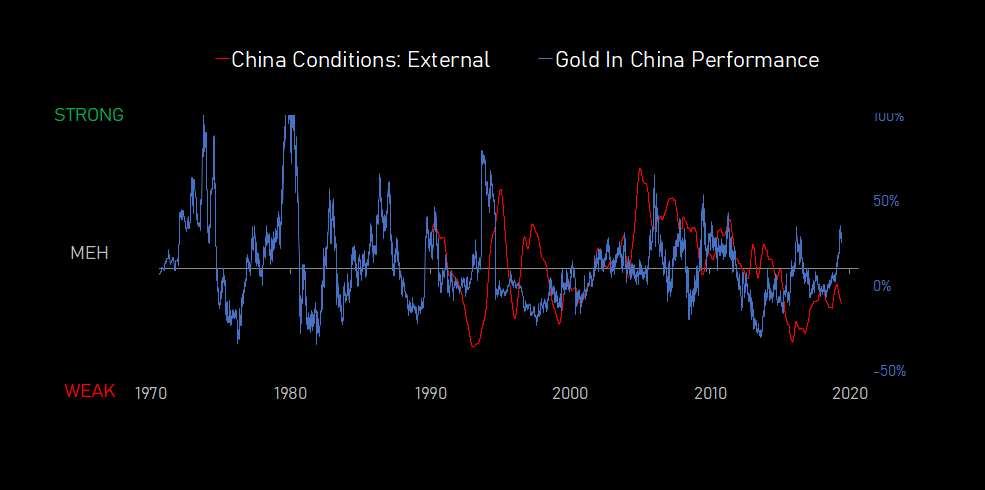
All of which leaves us reflecting on what that means for gold in China, if and when they promise to keep the peg.
At a minimum, if you expect furrther easing (which we do), you would expect bonds in China to do well. As policymakers lower rates and expand credit, both of which flow through to higher prices on bonds.
If you’re numbers inclined, you can also look at the math. And based on the historical relationship between deteriorating conditions and higher bond prices (aka lower bond yields), you’d also be bullish Chinese bonds (in local currency terms).
So to wrap up.
Conditions in China have deteriorated.
Usually when conditions in China deteriorate, you get easing.
The kind of easing that’s good for bonds and bad for the currency.
Which leaves us wondering, how can China really promise not the let the currency go? Especially, when it looks like they are going to need some easing soon?
And if they can’t make that promise, then what’s the deal?
The cost of gold
We've done pretty well on gold
because rates in the US are down
and the cost of gold
is not just the cost of the cash you spend to buy it
but the interest on that cash
you probably would have earned
and so your gold just sits there
earning nothing
while the yield of everything else makes money
your gold almost lazy
in it’s intransigence to yield
but what if that cash rate when negative?
and with it, your negative excess carry
cause now, you’re paid to own the thing,
compared to what you’d make sitting at Deutsche Bank,
waiting for the Brexit
in a race where everyone runs backwards
the winner just sits still
so imagine that world of negative rates
here, NYC, much closer to home
and now add in 1-3% inflation
and tell me where GLD is then?
On the tape for Gold in China at 10,500 rmb/ounce
Lucky Number 7
China’s yuan (as proxed by the USDCNH exchange rate) below 7 tonight.
Media having a hard time differentiating between whether it ‘fell’ or was ‘pegged’ lower.
Regardless of if it was market driven or pegging, once USDCNH got past 7, it kept running.
If you are reading this, you probably know what we think is behind this, and where it’s going.
We continue to remain long gold (and recommend those with the means hedge out the dollar on the other side of this trade by selling Chinese RMB against USD).
Big Ideas for the NewNew Deal - Transportation
At some point, we in the US are going to need to print some money to stimulate the economy.
Has anyone seen any of those ‘shovel ready’ projects mentioned back in the 2008 stimulus package? Me either.
So, with the goal of being constructive (it’s not all doom and gloom over here at BSC HQ) we’re starting a new series, called Big Ideas for the NewNew Deal.
In short, if you had to print and spend $3tr, where should it go?
Some of these ideas may sound a little zany, some of them are definitely half-baked. But the goal is to open the aperture, and hopefully help spur a more productive conversation about where all that money should go, when we open the fire-hose.
With that in mind, here’s Part 1: Transportation.
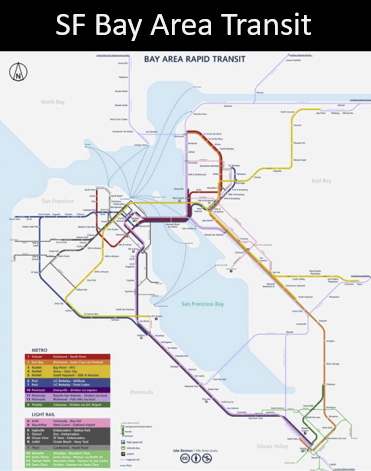
First step, let’s make all that cheap land in the East Bay accessible, through a functional transit system. When I first moved to SF I was shocked at how disconnected SF was from Oakland, owing to the fact you have basically one bridge connecting the two major metropolitan areas.
This is stupid, let’s fix it.
Come to think of it, why not invest in a real transit system for the entire Bay. One that connects Oakland as tightly to SF as Brooklyn and Queens are to Manhattan. Here’s a vision someone else cooked up.
Now let’s think a little bigger. America has always been a land of two coasts, even since the introduction of the Erie Canal connected the ocean coast of the east with the interior coasts of the great lakes.
Fifty years later came the intercontinental railroad, bringing the west to the east and the vision of a truly bi-coastal nation to life.
Fifty years after that, came the Panama Canal, another step forward in reducing the time and treasure required to move matter back and forth.
So why not bring that vision to the 21st century.
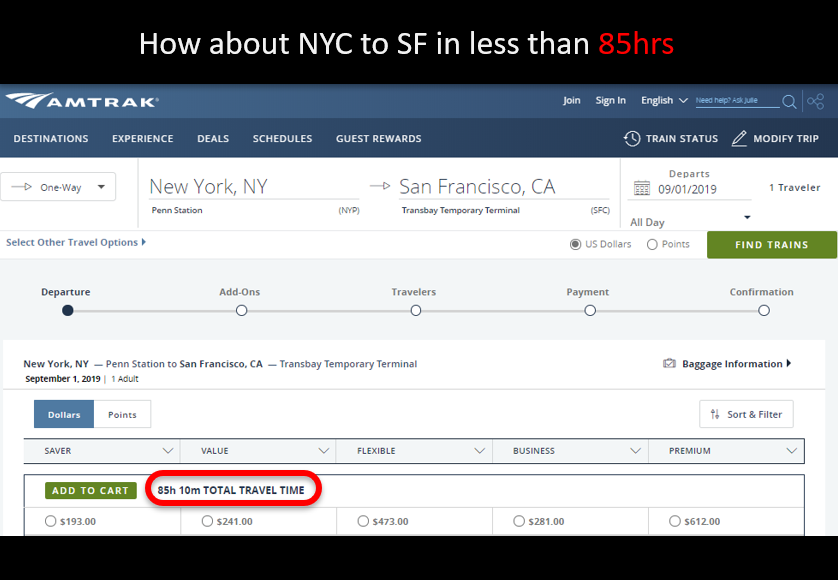
NYC to SF, via Detroit, Chicago and Colorado in ~10hrs, and no airport shenanigans. Bit better than the almost 100hrs it takes currently…
Something tells me if you could get to downtown Chicago in 30 minutes by train, Detroit wouldn’t be in such a ghost town…
Waiting for the crash by waiting for inflation
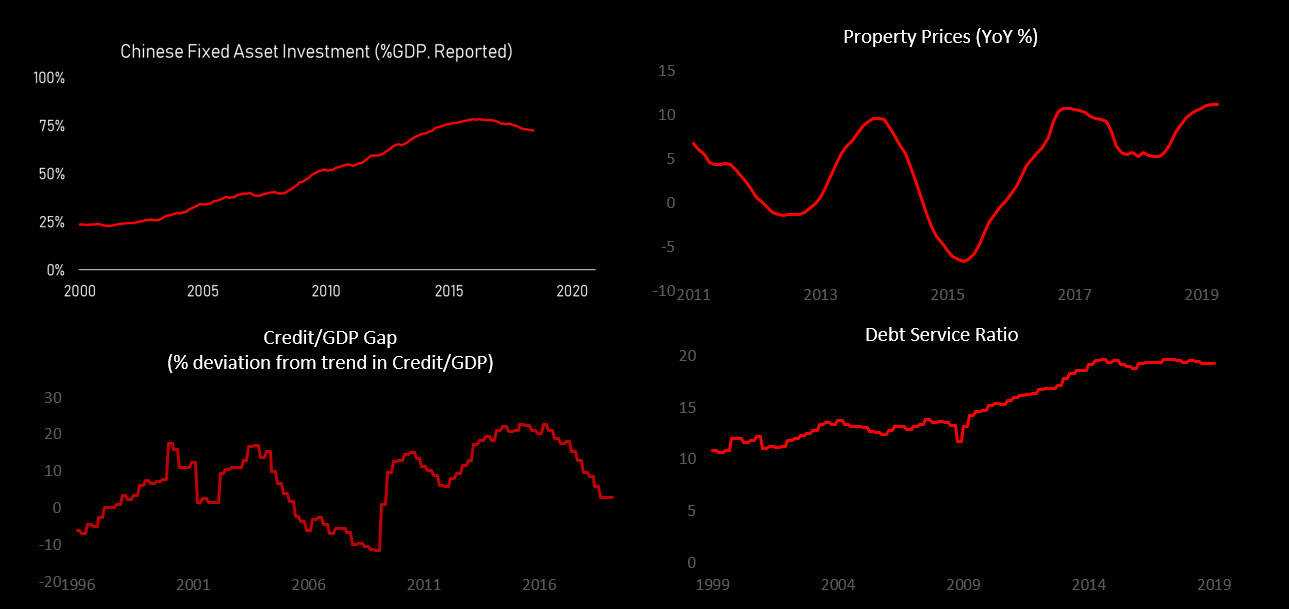
As we have mentioned in the past, we believe the single biggest macro risk to the global economy is the precarious nature of the Chinese financial system.
For those that lend some credence to Modern Monetary Theory, one might be inclined to believe that the Chinese Debt Bubble will not create a Chinese Financial Crisis, as the vast majority of debt in china is denominated in domestic currency.
Those applying MMT to China are missing out on a key ingredient, the fact that the RMB remains essentially pegged to the dollar, and so while debt in China is notionally denominated in ‘domestic currency’, policymakers have essentially underwritten the value of that currency in the global reserve currency.
While steps taken over the past decade have opened up both the exchange rate and the capital account in China, the peg by and large remains, defended by the stock of assets accumulated during China's strong current account stage of development.
To the extent that the RMB is not the dollar, it stands to reason at some point policymakers will have to choose between exercising control over domestic monetary conditions, and the promise to maintain parity with the dollar.
Enter Baoshang and Bank of Jinzhou
With the failure of Baoshang last month, and Bank of Jinzhou today, the writing on the wall for the shadowy elements of the Chinese financial system. There will be bank failures/resolutions, and there will be losses, though at the moment, nothing on the scale of western bankruptcies has been permitted.
Chinese policymakers, aware of the problem, have been putting mechanisms in place to expedite the inevitable restructuring of the financial system. Debt for Asset swaps, NPL securitization auctions, and organizing bank takeovers.
While the news about these moves have been pervasive, the actual use of these mechanisms pale in comparison to the scale of the underlying problem. As written in our work almost a year ago, much talk of deleveraging, without any real change.
As reserves slowly dwindle, the time for reform grows shorter and shorter. Policymakers play a dangerous game, supporting the perpetual motion machine through providing ample liquidity to insolvent lenders, while trying to force credit creation through the system to the parts of the economy that still have productive uses for capital.
Meanwhile, the scope and complexity of the problem metastasizes. WMPs and trusts have turned into DAMPS and TBRs and the market has slowly caught on to the game. Banks use non-loan channels to fund the extension of credit that would normally fail the bank loan sniff test, and in doing so, fund long term credit with short term liquidity. Intermediation of liquidity from good banks to bad banks via interbank lending, a classic game. Then a loan becomes a bond, the bond becomes an investment receivable, which allows a small regional lender like Baoshang bank to gobble up assets that normally would fall afoul of regulatory guidelines around risk, concentration and liquidity.
“Many interbank institutions might have blocked Bank of Jinzhou as a counterparty, which will likely wear the bank down. Regulators hope that the market keeps on doing business with Bank of Jinzhou and helps it pull through. So, currently they are discussing measures to resolve its liquidity problem,”
All of which begs the question, when does the music stop, and why?
We see the game as a simple application of the classical international monetary triliemma.
Independent monetary policy
A pegged (or managed) currency
A closed capital account.
Your move PBOC. Choose two.
What's interesting is that this occurring precisely at the moment that western economies suffer through the deflationary hangover from the 2008 crisis.
The Chinese credit bubble is not an independent phenomena, it has been supported, and extended, by the creation of liquidity in the west.
Thus, the sword of Damocles to the Chinese financial system is not domestic tightness, but tightness in the currencies she is pegged to: aka the dollar.
With the shift to easing in the west following the sell off in assets in 2H18, the PBOC has been given the gift of time.
Low / negative interest rates in the west, and the printing of money by developed world central banks lends the luxury of time to Chinese policymakers by a) limiting the scope of dollar appreciation (which would force the PBOC to choose between the peg and domestic liquidity provision) and b) generating excess liquidity in financial markets, some of which finds it's way to China in search of yield, balancing the persistent capital outflows from nationals trying to get ahead of the inevitable depreciation / confiscation of capital upon a banking crisis.
The market, addicted to central bank stimulus, has now given central bankers an ultimatum. Cut interest rates *multiple times* in the face of record high stock prices and record low unemployment, because…because we can.
Because there’s no inflation.
A level deeper, we see the ultimate enabler of this easing as being persistently low and stable inflation.
Were the trend in inflation to reverse, markets would be forced to price in higher nominal rates.
When inflation is 1% you can get away with nominal rates at 2% or 1%, but were it to rise to 3% even, then markets and central bankers would be forced to consider a world where nominal (and real) rates return to levels seen for 200 years (roughly 2.5% inflation and 2.5% real).
This would be a disaster for the asset classes and investment strategies that, following fed guidance and support, have moved radically out the risk and duration curve.
Not to mention popular (and well meaning) investment strategies that have convinced portfolio managers to add levered bonds and ever more illiquid private and venture equity to their portfolio.
It is this narrative which has convinced us at Black Snow that the return of inflation as being the single biggest risk to both western and eastern portfolios.
Inflation that would force central bankers to engage in actual tightening would seriously damage portfolios with too much duration and too little protection.
This tightening would then flow through to dollar strength, forcing the PBOC into a “Sophie's choice” between saving the financial system and keeping the peg.
It is with that in mind that we have renewed our research push to look across time and economic trends to better understand the causal drivers behind falling inflation. To understand if, and when, that trend will reverse, and with it the dominant narrative of the last fifty years of financial history.
We’ll keep you posted.
Sugar In China
Over the past decade, conditions in China have become ever more important for the global economy and the markets that trade it. At the same time, the opacity of the political and market systems behind “Capitalism with Chinese Characteristics” has put western investors in the unenviable position of being ever more dependent on the outcomes from a system most do not understand. The chart below shows our current picture of conditions in China.
Indicator of China Conditions
Last year we saw the consequences of that ‘tail wagging the dog’ phenomena. Dollar strength and policy tightening (in the US and China) led to deteriorating conditions in China which eventually flowed through to broad EM weakness and a sell-off in US markets. Midway through the year, Chinese policymakers shifted back to easing, which, when combined with a Q4 ‘pivot’ by the Fed, supported financial assets and economic activity.
Reacting to this policy easing, conditions in China have begun to improve, with prices for financial assets and commodities relatively strong and early indications of a bottom in real economic activity.
At the same time, the secular picture for the Chinese credit system remains ugly, with lots of noise about regulation, restructuring and reform, but no actual ‘deleveraging.’ With this in mind, we recommend investors take a bullish position in inflation-sensitive “soft” agricultural commodities (sugar, cocoa and coffee), hedged with a bearish position in the Hong Kong Dollar. This pairing represents a joint positive carry and positive convexity way to play both the inflationary upside of improving demand in China, as well as a world in which liquidity issues in the Chinese financial system result in a deflationary deleveraging and potential break in the peg to the USD.
There is a Credit Bubble In China
Two years ago at the Drobny Global Macro conference, we presented a framework for thinking about China in the context of the global cycle. This framework, detailed below, remains relevant amidst the noise of tit-for-tat tweets on sneakers and soybeans that populate our information channels these days.
1. There is a credit bubble in China.
2. The losses from this bubble will be large (and growing).
3. (Wise) Policymakers are aware of the problem, but have thus far been unwilling, or unable, to stop it.
Two years later, policymakers have made some progress curbing the worst excesses of an out of control shadow banking system without tackling the fundamental issues at play. Specifically, too much money which is leading to too much investment, therefore resulting in a domestic economy saddled with too much debt.
China Crisis Indicator
And in spite of years of talk of deleveraging, China and Hong Kong continue to top estimates of forward financial crisis risk.
During this time, banks have shifted to new lending from companies to households, who have in turn levered up to buy into ever more expensive real estate. While Chinese real estate data is notoriously sketchy, our best estimate is that real estate in second tier cities is now on par with that of developed nations like the US. Though with much lower household income levels to support those valuations.
Meanwhile, on the margin, the rest of the world has become ever more dependent on Chinese money creation, investment, and growth.
The way this story plays out will impact investors of every asset class. It is a well-established fact that Chinese conditions are a dominant driver of many energy and metal commodities markets. However, what we believe many investors are missing, is the degree to which the entire global economy is essentially long the Chinese credit bubble.
With the goal of understanding what’s going on in the Chinese economy today, we turn our attention to the notoriously sketchy data in China.
Answering the simplest questions with respect to growth conditions can be especially challenging in a country with scarce and unreliable data like China. Even in the best of circumstances, we would argue that GDP data is a poor measure of economic activity due to its low frequency, revisions, and lags. This is especially the case in China where Li Keqiang famously proclaimed that GDP statistics to be ‘man made’ and ‘for reference only’ while preferring rough proxies like electricity consumption, rail cargo volume and bank lending as a more accurate measure of cyclical momentum.
The Chinese Data Reliability Problem:
To solve this problem, we propose a theory fundamentally based on macro linkages.
In practice, the lines between these forces is much more blurry
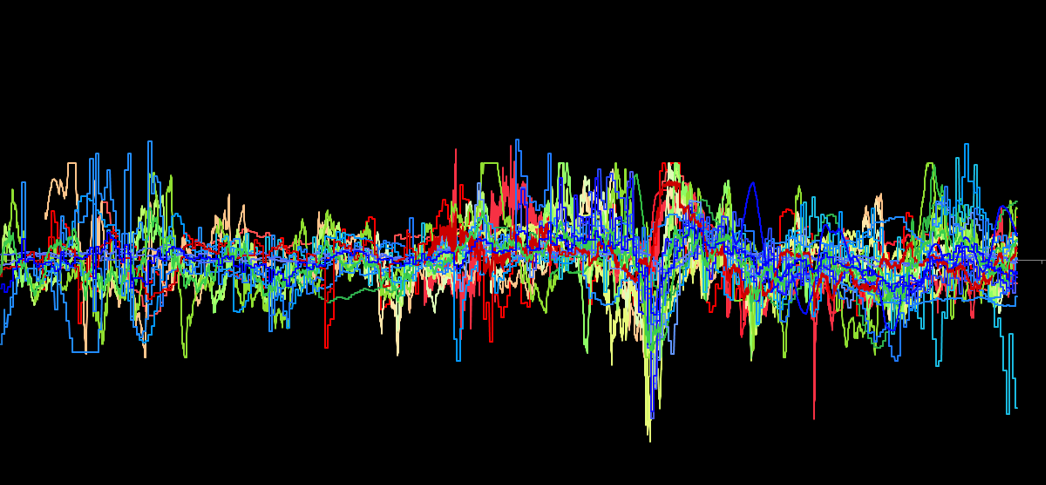
And the reality, is that even after combing through thousands of time series and cleaning them up, you are left with something that looks like this.
There's signal in this noise though, and by applying our framework for thinking about the Chinese economy we can see how policy has been used as a tool to manage first prices, and ultimately economic activity. Going into the beginning of last year, activity and prices were hot, and the government was tightening policy too manged. After six months of deterioration, policy shifted dramatically easier, which has begun to flow through to improvements in first prices, and potentially activity.
Machine – What Would a Machine Say?
Other than thinking through the causal linkages (aka deductive logic), one can also rely on unsupervised machine learning techniques like principal component analysis (aka inductive logic) to break down the underlying economic structure of the Chinese economy.
We started by gathering all the data we could find (100+ time series) for China from various categories: 1) money & credit aggregates, 2) real economy (GDP & components), 3) government sector, 4) external sector, 5) financial market prices, 6) property market, 7) consumer and corporate surveys and 8) alternative data (e.g. satellite).
We then transformed and normalized (z-score) the data in order to run a PCA.
We found that the 3 first principal components explained over 60% of the total variance. The first principal component loaded highly on measures of economic activity (figure 1), the second principal component loaded highly on measures of financial conditions (figure 2), and the third principal component loaded highly on measures like the external balance (figure 3).
Interestingly, the machine learning approach corroborates the notion that financial conditions (policy + prices) and activity are the key moving parts in the Chinese economy (figure 4).
Although information content with respect to growth/activity can lead to better asset allocation decisions, we are more interested in which if any markets our indicators can trade. The tables below compare the buy and hold risk-adjusted returns of various betas and markets to those using a simple scaling rule conditioning on our policy impulse indicator using monthly data. The rule scales exposure long or short each market based on the indicator’s value (z-score) the previous month (t-1).
This testing results tell a pretty logical story. Understanding conditions in China is helpful to understanding the future returns of some, but not all, assets. In particular it looks like this model has edge in understanding commodities, particularly those linked to Chinese demand.
With that in mind, we propose investors allocate capital into a strategy that has positive exposure to a rebound in Chinese conditions, but a positive carry, positive convexity way to play the protect that view from the existential risks of a liquidity event in China.
Below, we show the expected value matrix of our preferred trade expressions: a long position in Sugar in HKD, or 1) long sugar and 2) long USDHKD.
The genesis for this trade was made through extensive research using the Rose platform. If you are interested in viewing the data in an interactive environment, then please click the link below and play around with our platform. In addition, we would love to hear any feedback that you have regarding Rose if you do use it.
https://rose.ai/dashboard/china.system.drobny.notebook.20190424
Levered Stocks
When it comes to inflation protection, if you can’t buy commodities, sometimes it just makes sense to buy levered stocks.
Tails
Easing flowing through this week, weaker dollar, higher prices…
Everybody helping, rowing in the same direction.
Earning were strong for rich and growing tech empires. Pricing in more upside.
While the curve has no more tightening. Not a basis point to be seen.
So we bought inflation through the curve, and sold some fluffy tech.
Two world’s, and while one can’t know which, you gotta buy those tails.
Which then bring’s up that fateful question, of how to fund the carry.
So hold your nose, and buy that beta. Maybe even sell a little vol.
Just try not get caught, in one of those “2x1”s.
Those guys never end well.
Easing
The end of last year felt to some like the end of the world.
But the Powell’s shift from tightening to easing…
…also bailed out bonds.
Which means everything with a comparable duration just rallied 10%.
Now add in some dollar weakness
-
while Trump engages (yet again) in the very American process of checks and balances
-
and it could be party on.
Bubbles
We’ve been doing a lot of research on bubbles lately.
People talk a lot about the financial bubbles, the one’s that manifest in particular asset prices, or individual securities.
Then there’s your thematic/macro bubbles, the bubbles that follow technological innovations. The bubbles of the canal, the railroad, the telephone, the internet, and the handheld.
Each technological bubble, backed by the full faith and credit of the financial markets those very technologies have enabled. The bubbles of the company, the bond, the stock, the derivative, and the fund.
Step back and bit, and you start to see the bubbles that work on systems, the one’s that manifest in the push and pull of different models of civilization. The kind that inevitably resolve themselves in war, of one form of other...
The war/s of the central planner vs the wisdom of the crowd (starting in the Cold War and ….)
The wars of the nation vs the other (initiated by Napoleon and Bismark, and terminated by Mussolini, Hirohito and you know who)
The wars of the king vs the republic (with two false starts in Alexander, and Caesar, both trying to take democracy east, both falling prey to the egoism of empire).
And it reverberates down, each conflict of a kind, each essentially a conflict over and about culture. Each of these conflicts, a kind of bubble about culture. Each of these conflicts about the two-thousand year trend of the individual consistently taking more and more liberty out the hands of the state.
And if we’re being honest, we don’t know if this is a bubble.
Mostly because that chart doesn’t look that much different if you sub in a blue line of US money supply.
Maybe your answer to whether that’s a bubble or not just boils down to where you fall on the spectrum, the one that weighs the interests of the individual vs the interest in the community.
And maybe we’re wrong, not only about how the direction it plays out, but the why.
I guess we’ll see.
Log Scale


